Overview
Thank you for joining us for a special virtual edition of Data Driven, Canada’s premier data journalism event.
For those of you who couldn’t make in it “in-person”, you can check out both days of the event below.

Thank you for joining us for a special virtual edition of Data Driven, Canada’s premier data journalism event.
For those of you who couldn’t make in it “in-person”, you can check out both days of the event below.
High profile events like those that occurred at the United States Capitol on January 6 tend to be captured and shared online by the perpetrators themselves. Once shared, this data–some of which could contain evidence of crimes and atrocities–is vulnerable to imminent deletion either by social media platforms or by the users who shared it themselves. In this talk, Giancarlo will speak about Bellingcat’s efforts to crowdsource the collection of digital evidence for analysis and preservation.
Data narratives can transform the impersonality of a merely technical approach to AI by connecting models to what they really stand for: solutions, knowledge, industries, and people. IBM’s Mara Pometti shares how she established a data storytelling culture at IBM by applying an editorial approach to AI use cases.
This hands-on workshop will go through basic Boolean search skills that can be used on Twitter, Google, and other search engines to uncover information about a target or event. This workshop is ideal to people new to creative online searches who want to enhance their skills. It’s useful for reporters working in breaking news environments and investigators alike.
In September The Markup launched Blacklight, a real-time website privacy inspector. Building this tool took 18 months and was a huge technical undertaking. We built this tool because we were investigating the state of tracking on the internet, and wanted to tell the story in a way that left readers with a sense of agency, not apathy. In this talk I will go through how this tool was built and used internally for our own investigation ‘The High Privacy Cost of a “Free” website’.
A look at how the Digital Data Desk at the Canadian Press developed an automated system for generating COVID-19 stories and multiple charts. We’ll look at the original design concept, considerations for how data would be updated, the actual generation process and iterations to further automation.
Participants will learn about the founding philosophy and ethos of the newly-minted Investigative Journalism Bureau and the techniques and methods behind its inaugural series.
In this presentation we will discuss three main points:
Even a basic understanding of data journalism can give you an edge in story meetings. I’ve spent this past year reporting in a new province as the most junior reporter in a strong newsroom, and my “junior” data journalism knowledge has helped me pitch unique stories while adding new angles to “softer” story assignments. If I can use data to jazz up my stories, so can you.
Day 1 Timecodes:
In late October, The Globe and Mail published Bias Behind Bars, a front-page investigation into systemic racism in federal prisons using a database of more than 50,000 inmates obtained via a freedom of information request.
Risk assessments, used widely within the prison system, are meant to be an impartial guide of who can be rehabilitated and how soon, but racialized inmates routinely get the worst possible scores. These assessments are steeped in decades of research – but, as The Globe found, they’re also fundamentally, powerfully biased against Indigenous and Black inmates, placing them in higher security classifications and assigning them worse odds of successfully re-entering society.
Since Bias Behind Bars was published, the House of Commons’ public safety committee has announced a study on systemic racism in correctional risk assessments.
Project Pandemic is a data co-op and reporting collaborative providing support to Canadian news organizations cover the COVID-19 pandemic.
Last year I spent months tracking news reports on attacks by the Taliban and The Islamic State, for BBC’s media monitoring operation. We’ll take a look at how the BBC tracked and analyzed the human cost of the Afghan presidential election in 2019.
I’ll walk you through some key learnings from the project, how it was conceptualized and executed, the roadblocks along the way. Spoiler alert: ISIS’ data visual team is no joke.
We’ll also discuss how data can be used to turn the mirror on our industry for media research, analysis and critique.
Data journalism doesn’t mean laptop journalism, even if much of the work is by necessity done on the computer. Data journalism at its best reveals things about the real world, so getting out into the world is just as important as creating attractive and understandable visualizations. Jimmy Thomson, reporting on the spread of Indigenous Guardian programs on BC’s central coast, visited Wuikinuxv First Nation before he even had the data in hand. It wasn’t the first time he had been in the field with guardians, and those trips shaped his understanding of the story more than the data could.
This presentation will walk the audience through an independent project in which I analyzed multiple politicians’ social media content and developed an interactive news application using the Natural Language Processing (NLP) algorithm based on the analysis. I hope this presentation will inspire journalists on how to incorporate machine learning techniques into news production.
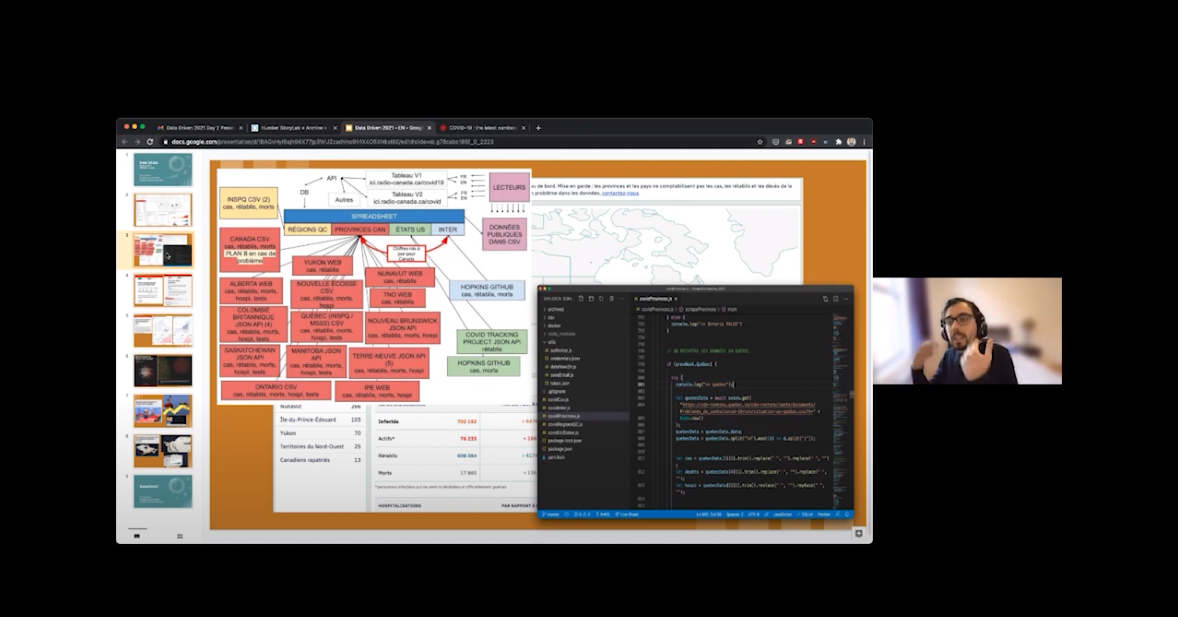
Radio-Canada’s Nael Shiab reflects on a year’s worth of COVID-19 data.
Microsoft’s Lukasz Pawlowski demonstrates how to use Microsoft Power BI to create interactive, embeddable data visualizations for your newsroom.
Day 2 Timecodes:
Interested in collaborating with StoryLab?
We’re always looking for new opportunities to push the boundaries of data-driven storytelling.